- Name
- Jill Rosen
- [email protected]
- Office phone
- 443-997-9906
- Cell phone
- 443-547-8805
- JHUMediaTeam
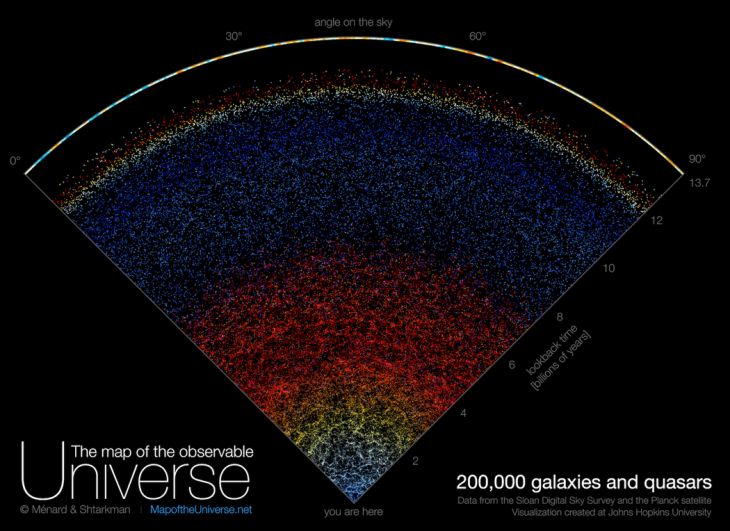
A new map of the universe displays for the first time the span of the entire known cosmos with pinpoint accuracy and sweeping beauty.
Created by Johns Hopkins University astronomers with data mined over two decades by the Sloan Digital Sky Survey, the map allows the public to experience data previously only accessible to scientists.
The interactive map, which depicts the actual position and real colors of 200,000 galaxies, is available online, where it can also be downloaded for free.
"Growing up I was very inspired by astronomy pictures, stars, nebulae and galaxies, and now it's our time to create a new type of picture to inspire people," says map creator Brice Ménard, a professor at Johns Hopkins. "Astrophysicists around the world have been analyzing this data for years, leading to thousands of scientific papers and discoveries. But nobody took the time to create a map that is beautiful, scientifically accurate, and accessible to people who are not scientists. Our goal here is to show everybody what the universe really looks like."
The Sloan Digital Sky Survey is a pioneering effort to capture the night sky through a telescope based in New Mexico. Night after night for years, the telescope aimed at slightly different locations to capture this unusually broad perspective.
The map, which Ménard assembled with the help of former Johns Hopkins computer science student Nikita Shtarkman, visualizes a slice of the universe, or about 200,000 galaxies—each dot on the map is a galaxy and each galaxy contains billions of stars and planets. The Milky Way is simply one of these dots, the one at the very bottom of the map.
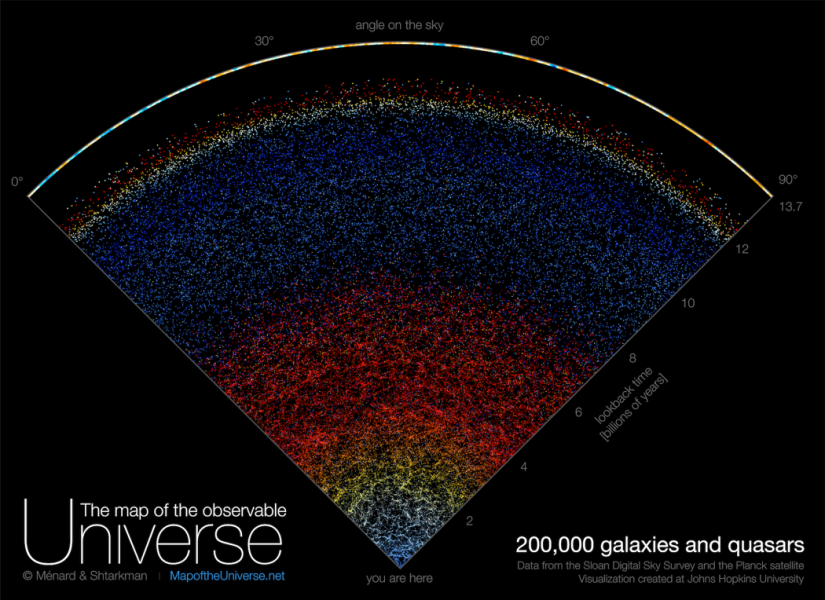
The expansion of the universe contributes to make this map even more colorful. The farther an object, the redder it appears. The top of the map reveals the first flash of radiation emitted soon after the Big Bang, 13.7 billion years ago.
"In this map, we are just a speck at the very bottom, just one pixel. And when I say we, I mean our galaxy, the Milky Way which has billions of stars and planets," Ménard says. "We are used to seeing astronomical pictures showing one galaxy here, one galaxy there or perhaps a group of galaxies. But what this map shows is a very, very different scale."
Ménard hopes people will experience both the map's undeniable beauty and its awe-inspiring sweep of scale.
"From this speck at the bottom," he says, "we are able to map out galaxies across the entire universe, and that that says something about the power of science."
Posted in Science+Technology
Tagged astronomy, astrophysics, space@hopkins